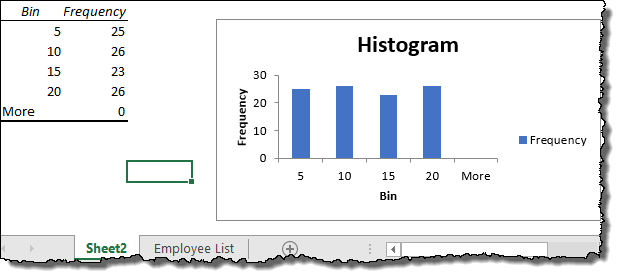

Histogram is different from Bar Chart in the way that Bar Chart groups data into nominal groups. One of the great use of histogram is to check whether the data is normally distributed (whether histogram can form a bell-shape), because most statistics analysis such as T-Test, Chi-Square etc require the data to be normal. Usually people don’t leave space between two bars because numbers are continuous, however you can still do it with space.

Histogram is a column chart that counts frequency of numbers and categorize the numbers into numerical groups (the groups are called bins). Types of data in statistics (Interval, Nominal, Ordinal).

How to Create Histogram in Stata | Stata Beginners Tutorial


 0 kommentar(er)
